The Network Watcher service in Azure provides us with a number of tools to help diagnose and monitor network issues.
One of these tools is Connection Monitor which we can use to perform regular network connectivity tests to a TCP port between
- 2 Virtual Machines in Azure or
- A Virtual Machine in Azure and a remote IP address
This is a handy tool in Azure which I have used a number of times recently, for example in one instance to monitor connectivity to a remote SQL instance hosted in AWS (connected via Azure Site to Site VPN) and in another case, when diagnosing an issue with printers becoming unreachable across an ExpressRoute circuit to a local site from a print solution hosted in Azure.
Connection Monitor does not support ICMP ping checks so sometimes you may need to get a little creative, for example in the instance of tracking printer connectivity, I tested against port 80 for the management web interface of the device to check it was online.
Enabling Network Watcher
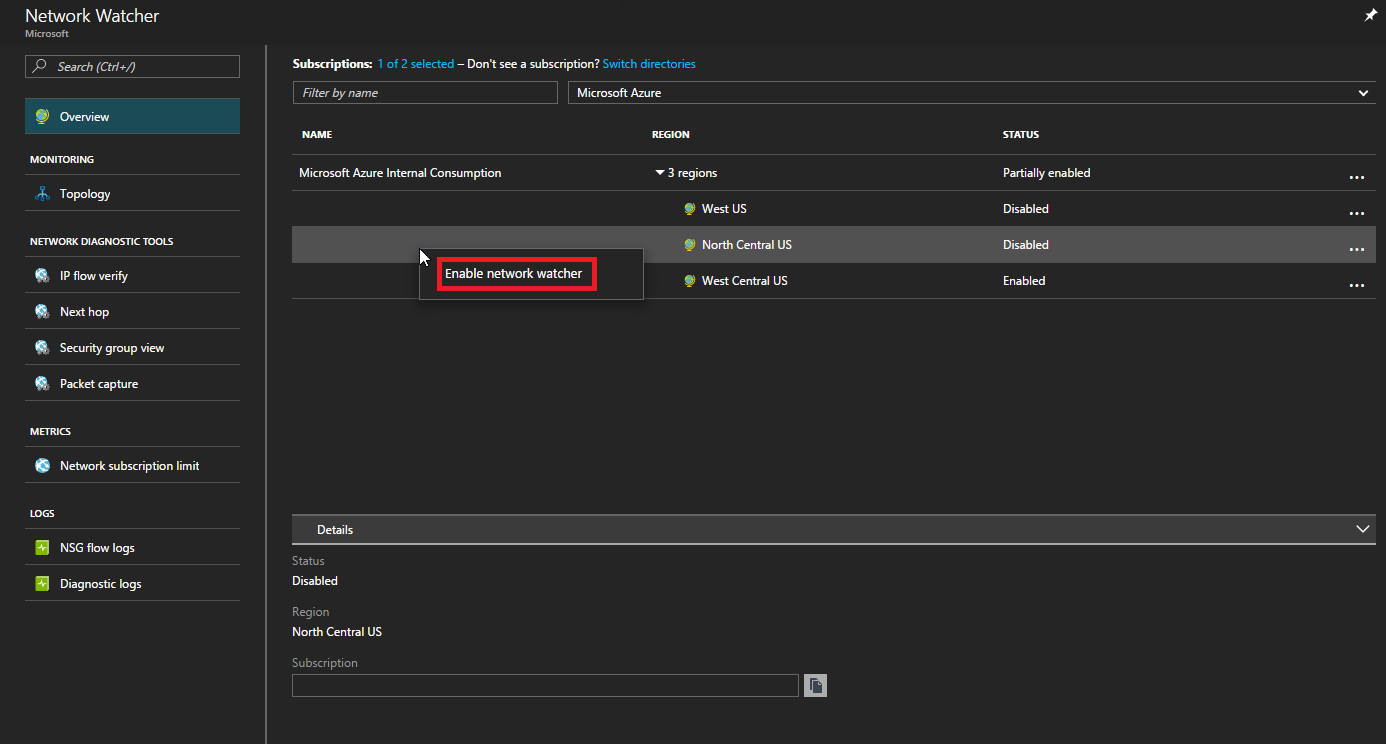
The first step is to check you have Network Watcher enabled for the necessary Azure subscription and region where you want to monitor traffic.
Login to the Azure portal and navigate to All Services > Networking > Network Watcher
You can select all the subscriptions you want to enable Network Watcher for. This action creates a Network Watcher in every region that is available.
Creating a connection monitor
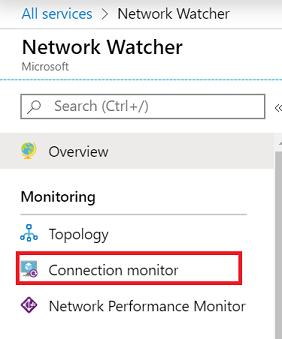
From the Azure Portal, again navigate to All Services > Networking > Network Watcher. From the menu on the left select Connection monitor from the Monitoring section.
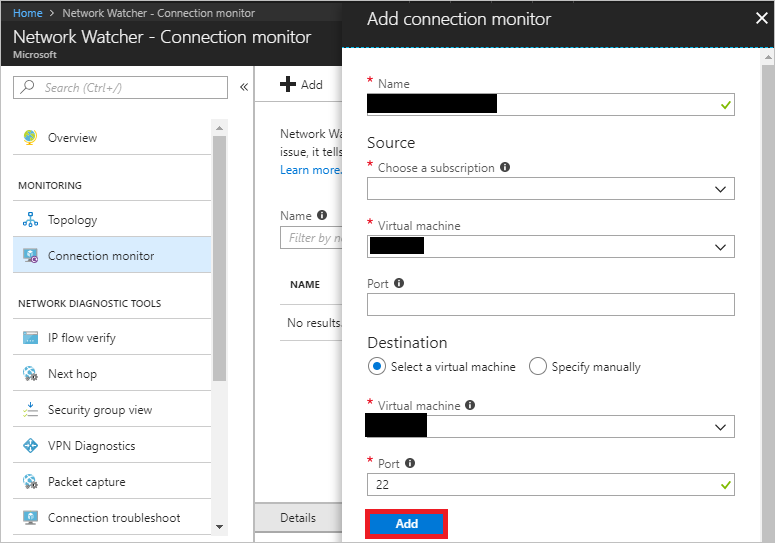
Press Add to create a new connection monitor.
- Enter the name for your monitor
- Select the Azure Virtual Machine you want to test from
- Then either choose the destination Azure Virtual Machine you want to monitor or select Specify manually to enter the IP address of a remote system or device you want to check against
- Finally enter the port you want to monitor connectivity to
By default, connection checks will be made every 60 seconds. If you want to change this value press Advanced settings and adjust the Probing interval as required.
Press Add to create the connection monitor.
Analysing the results
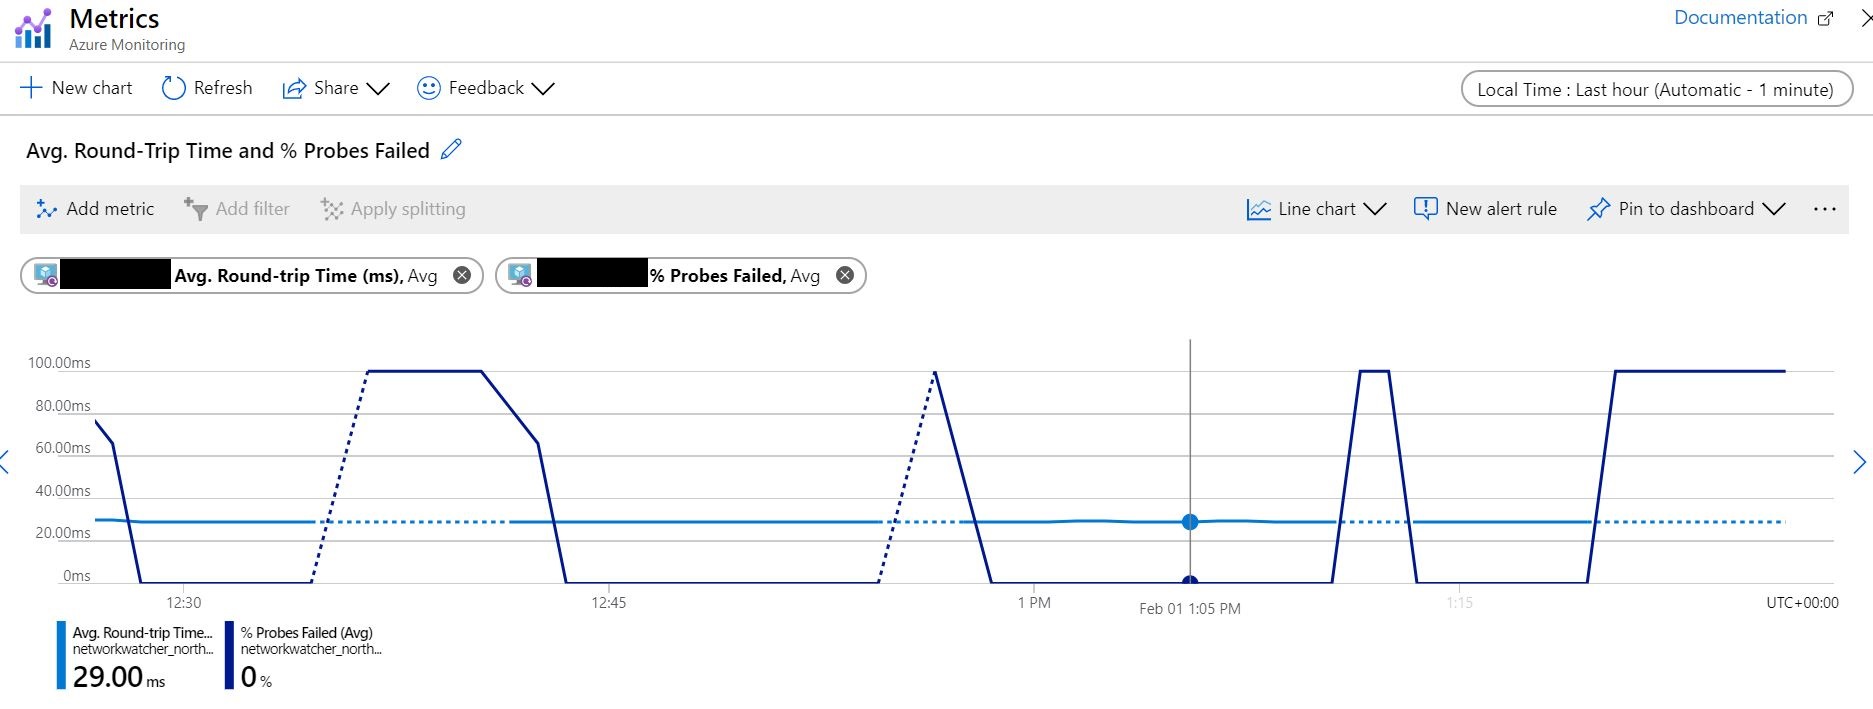
Once the network probes have ran, you will start to see the results of the connection monitor probe tests. These are outputted to a graph which you can adjust as necessary to drill down to the timeframe you want to investigate against.
Adding an alert
It is also possible to generate an alert when for example the connection monitor detects an anomily.
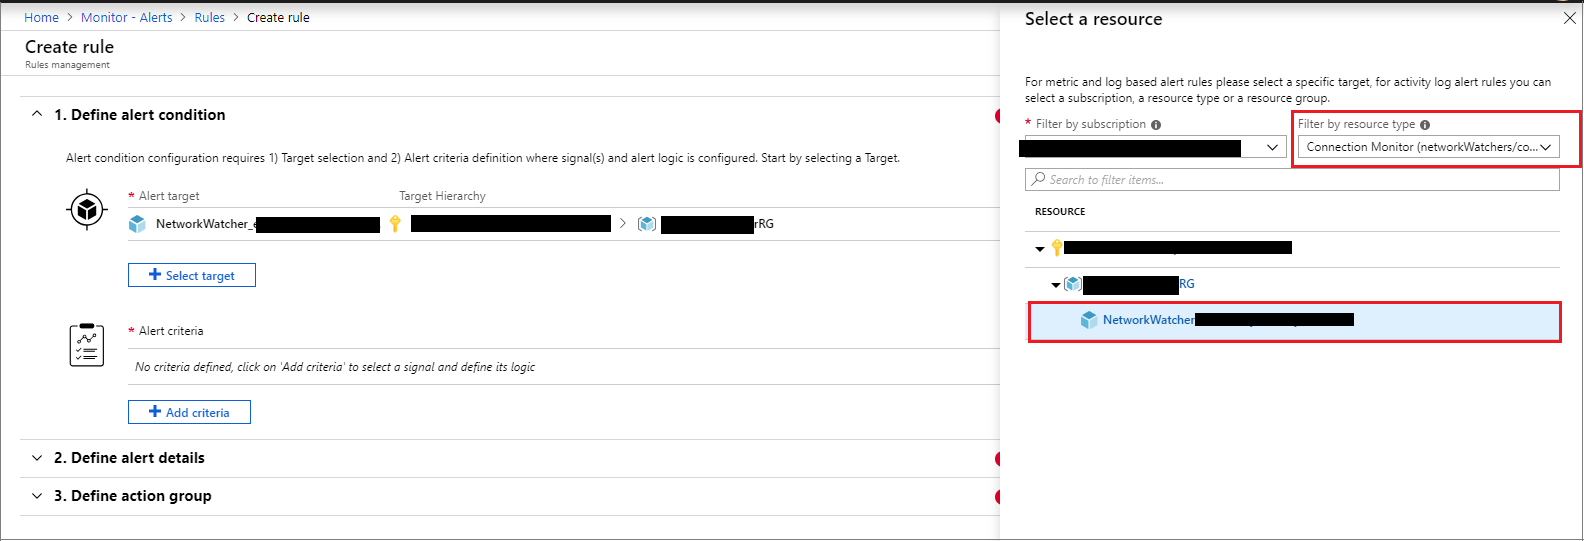
In Azure portal, select the Monitor service, and then select Alerts > New alert rule. Set the Resource type as Connection Monitor, then filter down to the Connection Monitor that you want to use.
Once you have selected a resource to target, under Condition press Add and select the metric you want to build the alert based upon. For example, % Probes Failed if you want to base the alert on failures or Avg. Round-trip Time (ms) if you want to alert based on a change to latency/response times
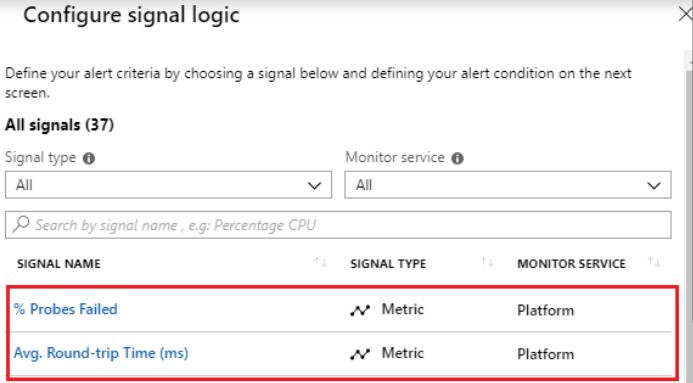
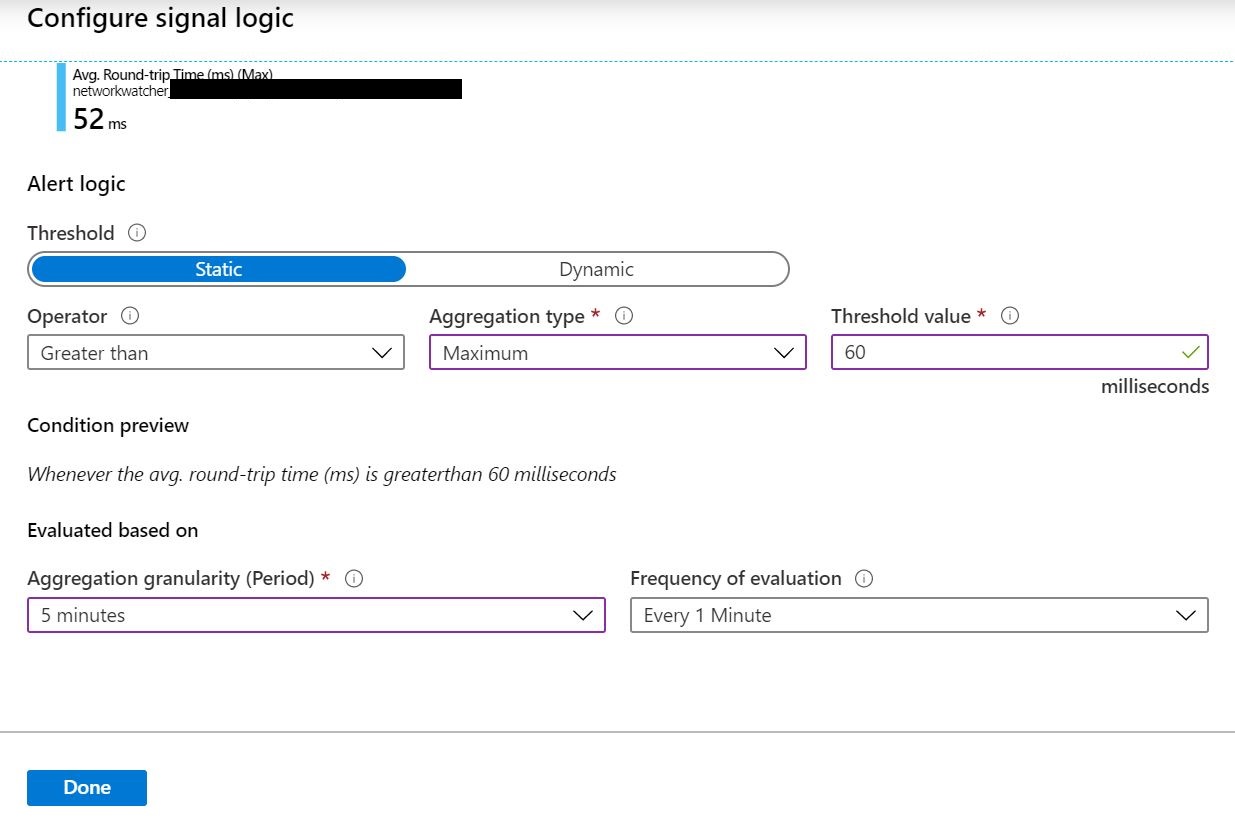
In this example I will select Avg. Round-trip Time (ms) and create an alert if the response time goes above 60ms.
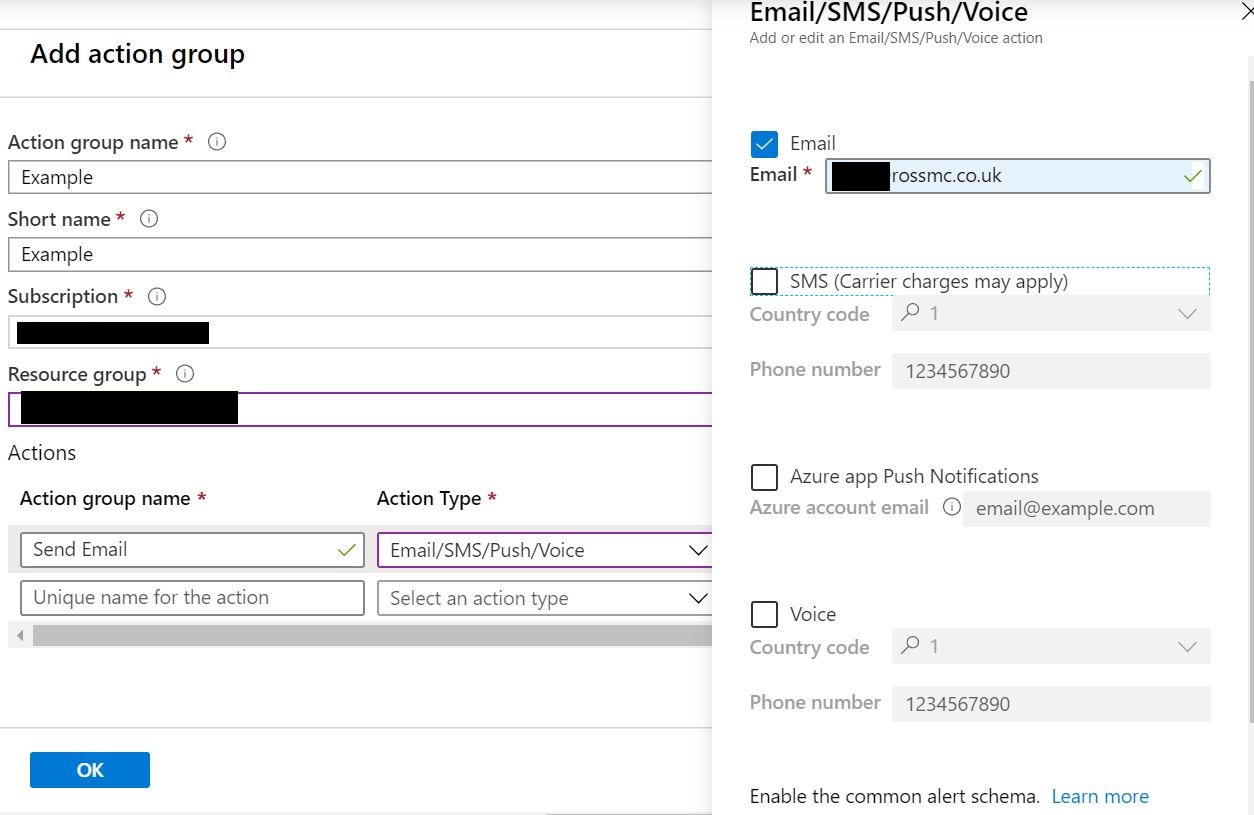
By using Action Groups we can perform actions such as sending an SMS or email when an alert is generated.
Press Create under Action Groups and setup your action group. In this example, we will send an email when the alert is raised.